Understanding Spark UI - Making sense of Jobs, Stages, Tasks
Updated: 07/25/21
In this post, we are going to talk about Spark UI elements such as Jobs, Stages, Tasks. It important to keep them into consideration when thinking about enhancing performance or debugging jobs.
Spark UI can be accessed at http://<your-spark-driver-host>:4040
Every query submitted to Spark creates a Spark job. Sub-queries run as separate jobs.
A Spark job is broken up into multiple stages. Stages have unique IDs across all jobs. A job creates a new stage whenever "shuffle" is performed and a stage is a collection of tasks that run same set of functions on each partition of data. Number of tasks in a stage is equal to the number of partitions in the input RDD of that stage.
For example, if our goal is to list files in a directory, and there are 10 tasks in a stage, then during that stage it is going to list files on 10 directories. Another example, if our goal is to count records and there are 10 such tasks, then it is going to count records individually in each of the 10 partitions of your data provided as an input to that stage. This is similar to "map" tasks of map-reduce in Hadoop world.
Let us look into an example in which we execute a
count() on a DataFrame which is constructed by reading a CSV file. Below are the details of the query taken from the "SQL" tab of Spark UI:
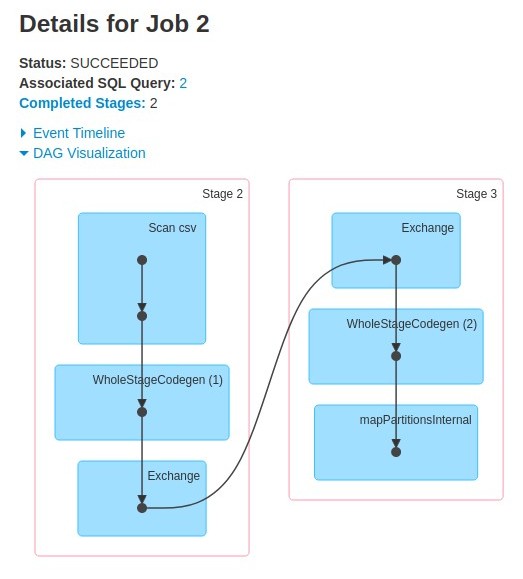
As shown in the flowchart above, the first node scans the CSV file and the final node outputs one row which contains the count of records in the CSV file. Third node performs an "Exchange" (or shuffle) which causes this job to split into two stages as we discussed earlier. Job Details view below clearly shows that the job is split at "Exchange" node:

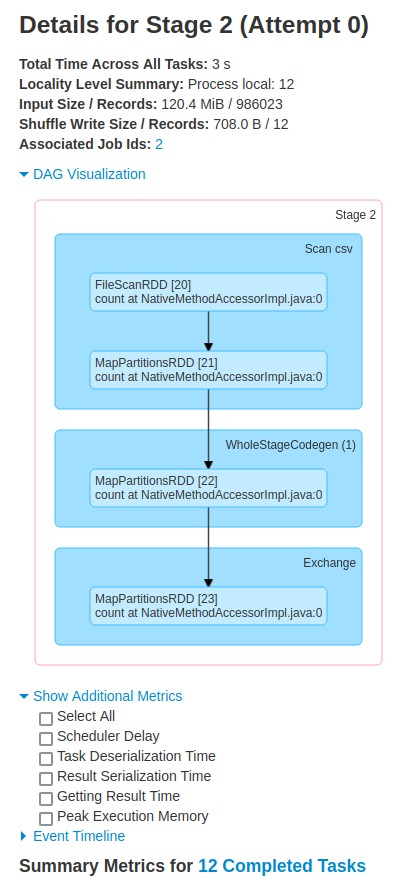
The flowchart below shows more information about the first stage with id=2. Notice that the "Input Size" of this stage is ~120MB. We have 12 workers in our spark cluster so this stage is split into 12 tasks. Read the blog post on partitioning to learn more about how your data is partitioned based on the number of workers.

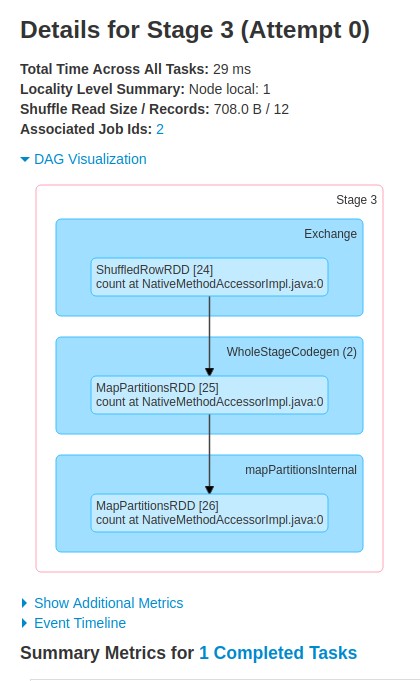
Flowchart below shows information about the second stage with id=3. Notice that this stage does not have any "Input Size/Records" field but instead it has a field called "Shuffle Read Size/Records". This is the input to this stage because it was created at the shuffle boundary. It only has 1 task because its output is to provide the count of records which takes just 1 partition.

You can click on an individual stage on the Jobs page to get detailed information about the tasks in that stage. It will provide useful information about each task such as:
- Host where the task ran
- Duration
- Input Size / Records
- Shuffle Write Size / Records
Summary metrics for all the tasks in that stage is also available that contains metrics such as Min, 25th Percentile, Median, 75th Percentile, Max.
Event timeline for all the tasks in a stage is also available that shows start time of each task along with various stages in its life cycle marked in different colors. Image below shows an example from the first stage with id=2 that we discussed earlier:
 4
4A confusing metric about the time taken by the tasks is "Total Time Across All Tasks" which is provided at the top of the stage page and "Task Time" which is provided under "Aggregated Metrics by Executor". To find out the difference between these two metrics I dug into the source code of Spark (version 3.0.1) and found out the following:
Total Time Across All Tasks calculation:
task.metrics.setExecutorRunTime(TimeUnit.NANOSECONDS.toMillis(
    (taskFinishNs - taskStartTimeNs) – task.executorDeserializeTimeNs))
Task Time calculation:
stage.jobs.forEach { job =>
..
esummary.taskTime += event.taskInfo.duration
}

duration() {
    return finishTime - launchTime
}
This shows that "Total Time Across All Tasks" should be lower because it subtracts
task.executorDeserializeTimeNs from the duration whereas the "Task Time" does not.There is more information available in the Spark UI than what we covered in the post, but this should provide a good starting point in understanding how to interpret it.